Instacart insight
Weiwei Qi
most_aisle_orders = instacart %>%
  group_by(aisle) %>%
  summarise(n = n()) %>%
  left_join(., instacart %>% select(aisle, department) %>% unique(), by = "aisle")

top_1_aisle = most_aisle_orders %>%
top_n(1, n)- There are 134 aisles, and the most items are ordered from the
fresh vegetablesaisle, in which 150609 items were ordered. The top 3 aisles arefresh vegetables,fresh fruits, andpackaged vegetables fruits. The three lest orders aisles arebeauty,frozen juice, andbaby accessories.
each_aisle_order = most_aisle_orders %>%
  filter(n > 10000)

# reorder() the scatter plot in descending order.
aisle_fig = each_aisle_order %>%
  ggplot(aes(x = reorder(aisle, -n), y = n, na.rm = T)) +
  geom_col(aes(fill = department), color = "black", position = "dodge") +
  theme(axis.text.x = element_text(angle = 45, hjust = 1, size = 8),
        axis.text.y = element_text(size = 10)) +
  labs(x = "aisle", y = "order numbers", title = "Most popular aisles") +
  scale_y_continuous(breaks = seq(0, 160000, by = 10000))

ggplotly(aisle_fig)
There are total 39 aisles with more than 10000 items ordered. In them, fresh vegetables, fresh fruits, and packaged vegetables fruits are the top 3 aisles. The median of the orders is 16201, the mean of the order is 2.728110^{4}.
(joint_table = instacart %>%
  filter(aisle %in% c("dog food care", "baking ingredients", "packaged vegetables fruits")) %>%
  group_by(aisle, product_name) %>%
  summarise(order_times = n()) %>%
  group_by(aisle) %>%
  arrange((desc(order_times))) %>%
  top_n(3, order_times) %>%
knitr::kable())| aisle | product_name | order_times |
|---|---|---|
| packaged vegetables fruits | Organic Baby Spinach | 9784 |
| packaged vegetables fruits | Organic Raspberries | 5546 |
| packaged vegetables fruits | Organic Blueberries | 4966 |
| baking ingredients | Light Brown Sugar | 499 |
| baking ingredients | Pure Baking Soda | 387 |
| baking ingredients | Cane Sugar | 336 |
| dog food care | Snack Sticks Chicken & Rice Recipe Dog Treats | 30 |
| dog food care | Organix Chicken & Brown Rice Recipe | 28 |
| dog food care | Small Dog Biscuits | 26 |
The top 3 popular item in aisle packaged vegetabkles fruits are all organic products: Organic Baby Spinach, Organic Raspberries, Organic Blueberries. It is noticeable that the No.3 popular product in packaged vegetabkles fruits is ordered almost ten times as much as the top 1 popular product in the baking ingredients aisle, same goes for baking ingredients and dog food care.
(apple_coffee = instacart %>%
  filter(product_name %in% c("Pink Lady Apples", "Coffee Ice Cream")) %>%
  group_by(product_name, order_dow) %>%
  summarise(mean_hr = mean(order_hour_of_day)) %>%
  mutate(order_dow = recode(order_dow, `0` = "Sun.", `1` = "Mon.", `2` = "Tues.", `3` = "Wed.", `4` = "Thur.", `5` = "Fri.", `6` = "Sat.")) %>%
  pivot_wider(
    names_from = order_dow,
    values_from = mean_hr
  ) %>%
knitr::kable())| product_name | Sun. | Mon. | Tues. | Wed. | Thur. | Fri. | Sat. |
|---|---|---|---|---|---|---|---|
| Coffee Ice Cream | 13.77419 | 14.31579 | 15.38095 | 15.31818 | 15.21739 | 12.26316 | 13.83333 |
| Pink Lady Apples | 13.44118 | 11.36000 | 11.70213 | 14.25000 | 11.55172 | 12.78431 | 11.93750 |
Mean order time of the Coffee Ice Cream across week is about 13:00 to 15:00. It may imply that people have the tendency to buy coffe related item after lunch time. Most mean order time of the Pink Lady Apples is about 11:00 to 12:00 o’clock of the day. On Wednesday however, the mean order time is about 2 hrs late than the other 6 days.
- The original data has 1384617 observations and 15 variables.
- Main key variables include
product_name,aisle. The two variables is mostly used in exploring the popularity of a product and the aisle it belongs to. - The observation gives identical information about each order, including who bought what, from which category(aisle). Each row of observation might have some categories the same, but it is impossible to be identical in every category. Each row of observation is unique on the whole categorical level. For example, the first row of observation of the dataset means that a customer(user id: 112108) bought the Bulgarian Yogurt(product id: 49302) from the yogurt aisle(aisle id: 120), which belongs to the daily eggs department. This order is his 4th order, and he had bought this product before(reordered == 1). It has been 9 days since the last time he bought the same yogurt.
Order pattern
When - in a day?
bar_plot_hod = instacart %>%
  group_by(order_hour_of_day) %>%
  ggplot(aes(x = order_hour_of_day, fill = department)) +
  geom_bar() +
  theme_classic() +
  xlab("hour of day") + ylab("orders")

ggplotly(bar_plot_hod)
Which day?
bar_plot_dow = instacart %>%
  group_by(order_dow) %>%
  ggplot(aes(x = order_dow, fill = department)) +
  geom_bar() +
  theme_classic() +
  xlab("day of week") + ylab("orders")

ggplotly(bar_plot_dow)
How many orders do people usually take?
# instacart %>% select(order_number) %>%
#   ggplot() + geom_histogram(aes(x = order_number))
#
# instacart %>%
#   select(user_id, order_number) %>% unique() %>%
#   count(order_number)
#
# instacart %>% count(order_number)

instacart %>%
  select(user_id, order_number) %>% unique() %>%
  count(order_number) %>%
  plot_ly(x = ~order_number, y = ~n, color = ~order_number,
          type = "bar", colors = "viridis")
Reorder pattern
How often?
bar_plot_reord = instacart %>%
  group_by(days_since_prior_order) %>%
  ggplot(aes(x = days_since_prior_order, fill = department)) +
  geom_bar() +
  theme_classic() +
  xlab("day of week") + ylab("orders")

ggplotly(bar_plot_reord)- Most people reordered every 7 or 30 days
Basket size
basket1 = instacart %>% group_by(order_id) %>%
  summarize(basket_size = n(),
            reord_items = sum(reordered))

basket2 = basket1 %>%
  group_by(basket_size) %>%
  summarize(n = n(), avg_reord_items = mean(reord_items)) %>%
  mutate(avg_reord_perc = avg_reord_items / basket_size,
         avg_reord_perc_round = round(avg_reord_items / basket_size, 3)) %>%
  arrange(basket_size) %>%
  mutate(basket_size = as.factor(basket_size),
         avg_reord_perc = as.factor(avg_reord_perc),
         avg_reord_perc_round = as.factor(avg_reord_perc_round))
# avg_reord_perc has to be factor level so it wont cause error in ggplotly

basket2_fig = basket2 %>%
  ggplot(aes(x = basket_size, y = n)) +
  geom_col(aes(fill = avg_reord_perc_round)) +
  labs(y = 'Order Count',
       x = 'Number of Items in Basket',
       title = 'Basket Size Distribution') +
  theme(axis.text.x = element_text(size = 6.0, angle = 90,
                                   hjust = 1, vjust = 0.5))

ggplotly(basket2_fig)
The distribution is right-skewed
the range of basket size is between 1-80 items
most people order only 4-8 items at once
Most people have a reorder frequency lower than 0.6
Intriguing how people with either small basket (<4 items ) or fairly large basket (>=20 items) have higher reorder frequency
Reorder ratio
temp1 = instacart %>% filter(order_number > 1) %>%
  # exclude first order, which will never have reordered
  count(reordered) %>% mutate(ratio = n/sum(n)) %>%
  mutate(reordered = as.factor(reordered))

temp1 %>% ggplot(aes(x = "", y = ratio, fill = reordered)) +
  geom_col(width = 1) + labs(y = "Product Reordered Ratio") +
  coord_polar(theta = 'y', start = 0) + scale_fill_brewer(palette = 2) +
  theme(axis.title.y = element_blank())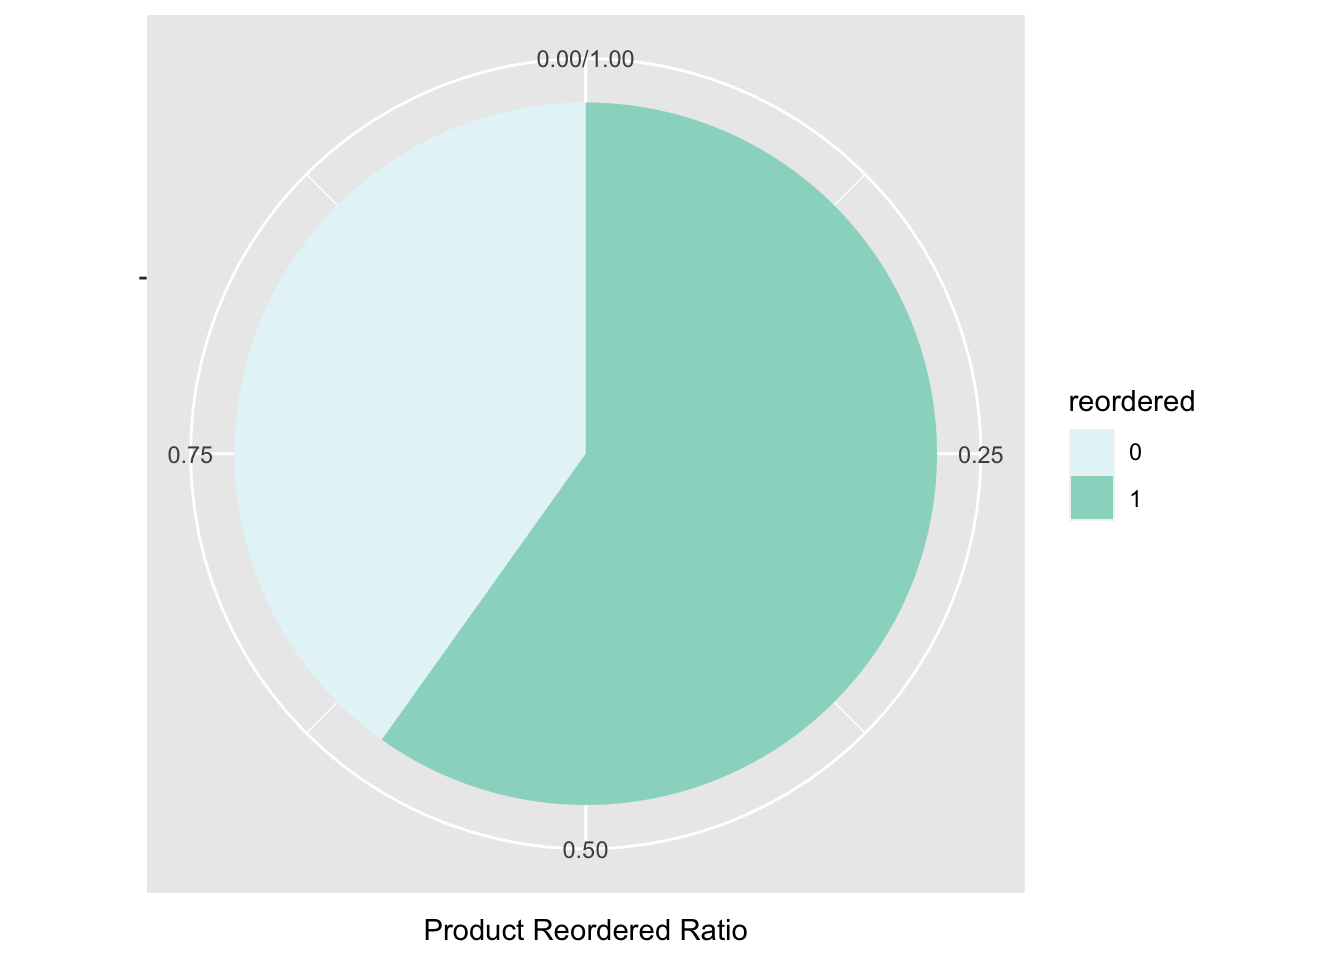
tmp2 <- instacart %>% count(product_id) %>% # filter only top 10 products for reorder analysis
  top_n(n = 30) %>% left_join(instacart) %>% # now find out their reordered rate
  group_by(product_id, product_name) %>%
  summarize(reordered_rate = sum(reordered, na.rm = TRUE)/n()) %>%
  left_join(instacart %>% select(product_id, department), by = "product_id") %>%
  unique() %>%
  arrange(desc(reordered_rate))

p2 <- tmp2 %>% ggplot(aes(x = reorder(product_name, reordered_rate),
                          y = reordered_rate, fill = department)) +
  labs(title = 'Top 30 Products Sold and Their Reordering Rate') +
  geom_col() + scale_y_continuous(limits = c(0, 1),
                                  breaks = seq(0, 1, by = 0.1)) +
  coord_flip()

ggplotly(p2)
# Q: can we make a prompt so that we can choose top n by input?- No doubt people enjoy fruits